Tools
![]()
Mississippi Phosphorus Index (MS-PI)
The PI for Mississippi (MS-ECS-TN05) is the NRCS approved nutrient risk assessment for phosphorus. The tool is used to assess the site and management practices for potential risk of phosphorus movement to water bodies. The PI uses specific field features and management practices to obtain an overall rating for each field. Mississippi uses a tool that considers transport characteristics such as soil erosion and soil runoff class; distance water, and source characteristics which are weighed according to their influence toward phosphorus movement. There are four rates of application; low (<5), moderate (5.1-9), High (9.1-22), and very high (>22) where no P can be applied. The ranking of the PI identifies where the risk of phosphorus movement is relatively higher than that of other sites. Analysis and identification of parameters of the PI that could be influencing the index disproportionately should be considered the basis for planning corrective soil and water conservation and management techniques (NRCS, 2007).
![]()
RUSLE2
The Revised Universal Soil Loss Equation 2 (RUSLE2) estimates soil loss from rill and interrill erosion caused by rainfall on cropland.
Third Party Apps
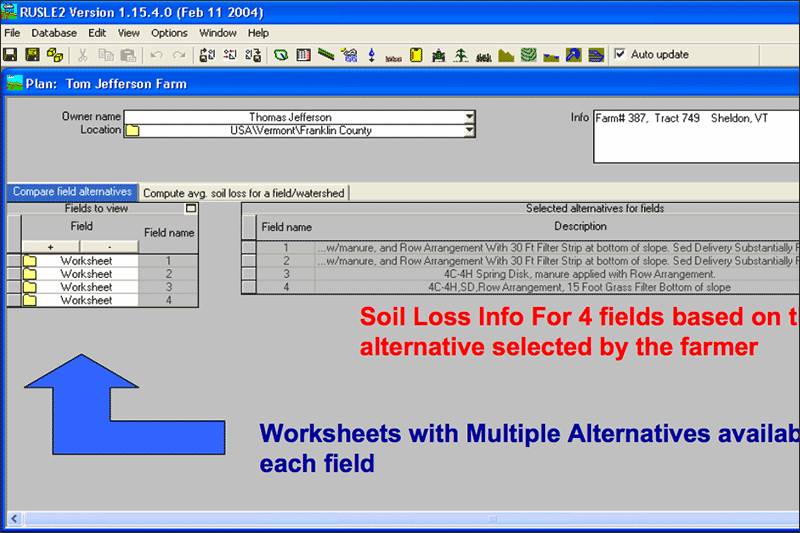
Revised Universal Soil Loss Equation 2 (RUSLE2)
RUSLE2 is an erosion prediction tool that is intended for all conservation planning, inventory erosion rates and estimate sediment delivery, this tool is a modified version of the RUSLE and USLE tool. RUSLE2 was developed jointly by the USDA-Agricultural Research Service (ARS), the USDA-Natural Resources Conservation Service (NRCS), and the University of Tennessee. The Revised Universal Soil Loss Equation 2 (RUSLE2) estimates soil loss from rill1 and interrill erosion caused by rainfall on cropland. In other words, RUSLE2 is an advanced, user-friendly software model that predicts long-term, average-annual erosion by water. It runs in a Windows environment, and can be used for a several alternative combinations of crop system and management practice. It also considers specified soil types, rainfall patterns, and topography. When these predicted losses are compared with soil loss tolerances, RUSLE2 provides specific guidelines for effective erosion control.
RUSLE2 computes values for the three fundamental erosion processes of detachment (sediment production), transport, and deposition. The empirical equation form of the USLE is used to compute detachment while process-based equations are used to compute sediment transport and deposition. These equations, which are written for a point in time and a location on an overland flow path, are integrated in both time and distance to produce average annual and spatial estimates for segments along the overland flow path and for the entire overland flow path.
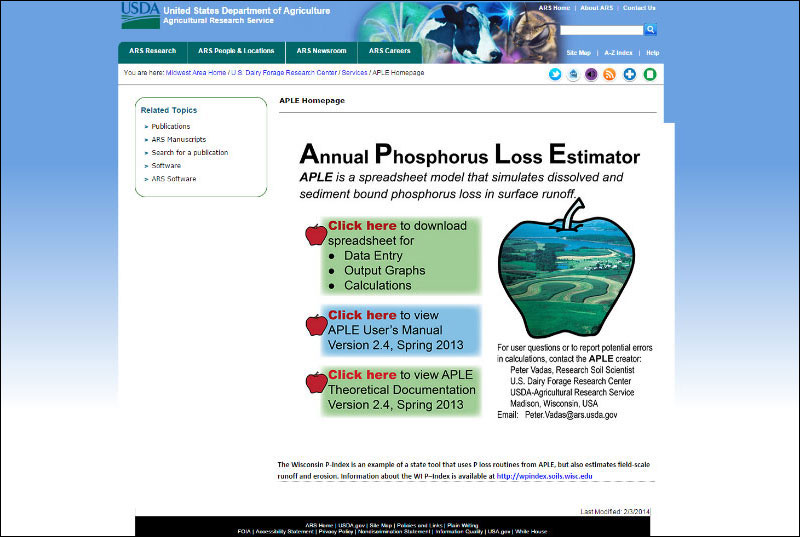
Annual Phosphorus Loss Estimator (APLE)
APLE is a Microsoft Excel spreadsheet model developed by USDA scientists that can help agribusiness model phosphorus loss in runoff and determine ways to reduce these losses. The model simulates on an annual time step sediment bound and dissolved phosphorus loss in surface runoff. It is a field scale model that has shown to provide good predictions of P loss for a wide range of climatic and land use conditions (Vadas et al, 2009). APLE does not calculate erosion or runoff, so to run the model requires estimates of these entered variables. The program can also be used to quantify field-scale phosphorus loss and soil phosphorus changes over 10 years for a given set of runoff, erosion and management conditions.
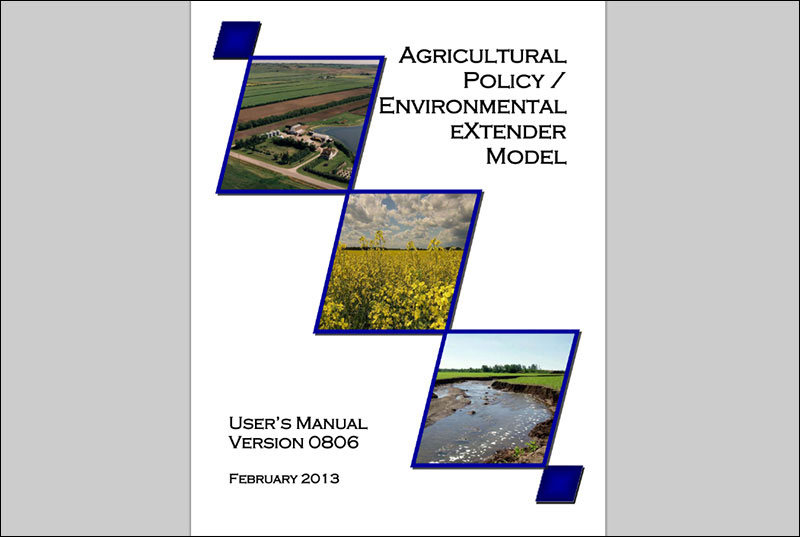
Agricultural Policy Environmental eXtender (APEX)
The APEX model was developed to extend the Erosion Productivity Impact Calculator (EPIC) model as a tool for managing entire farms and watersheds to obtain sustainable production efficiency and maintain environmental quality. The EPIC/APEX models have been widely tested for their ability to simulate different agricultural management practices at both field and watershed scales (Wang et al., 2011). APEX functions on a daily time step and can simulate hundreds of years for approximately one hundred different crops. The routing of water, sediment, nutrient, and pesticide capabilities are some of the most comprehensive available in current landscape-scale models and can be simulated between subareas and channel systems within the model. The routing model components in APEX allows evaluation of interactions in a watershed and between fields in respect to surface run-on, sediment deposition and degradation, nutrient and pesticide transport, water percolation, lateral subsurface flow and nutrient leaching (Steglich and Williams, 2008). The model can also be configured for land management strategies such as irrigation, drainage, furrow diking, buffer strips, terraces, waterways, fertilization, manure management, lagoons, reservoirs, crop rotation and selection, pesticide application, grazing, and tillage.
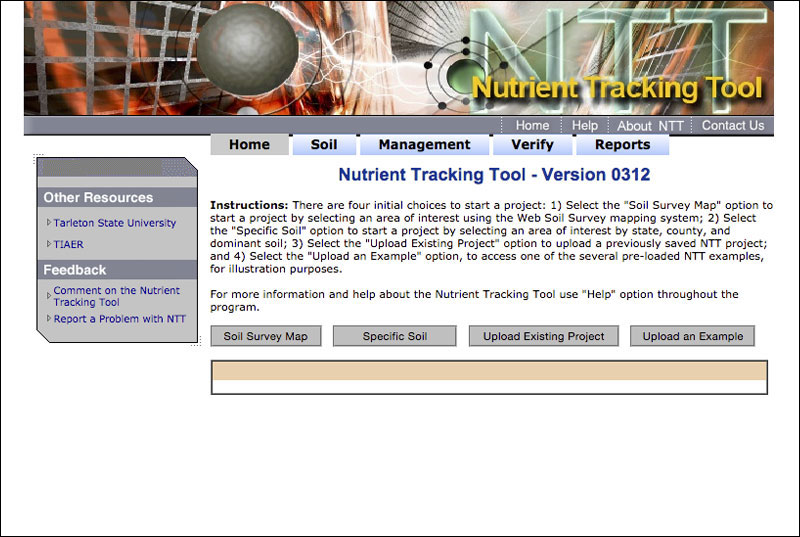
Nutrient Tracking Tool (NTT)
The NTT model is a user-friendly web-based computer program designed and developed by the USDA-NRCS, USDA-ARS, and Texas Institute for Applied Environmental Research (TIAER). The NTT compares agricultural management systems to calculate a change in nitrogen, phosphorous, sediment loss potential, and crop yield. A baseline management system and an alternative conservation management system can be compared when the model produce a report showing the nitrogen, phosphorous, sediment loss potential, and crop yield difference between the two systems. The tool estimates annual average and monthly average nitrogen, phosphorus and sediment losses from fields managed under a variety of cropping patterns and management practices through a user-friendly linkage to the APEX model (Saleh et al, 2011).
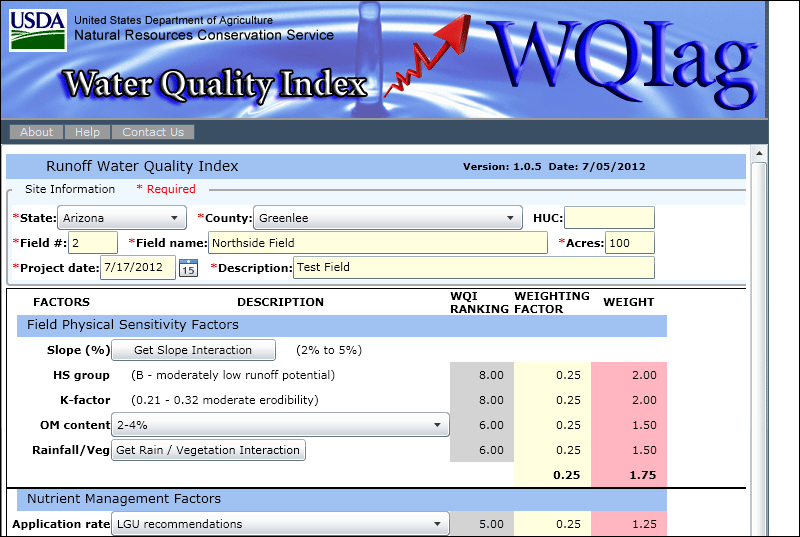
Water Quality Index for Agricultural Runoff (WQIag)
The WQIag is an online tool, currently in the pilot phase, developed by scientists at the USDA-NRCS to help farmers and ranchers understand the quality of water flowing off their fields. The WQIag is also considered as a tool for evaluating the success of conservation practices for improving water quality. The tool gives producers an assessment of their water quality instead of focusing on just one aspect such as temperature, nutrients or pesticide content. Field characteristics and soil physical/erosion factors, nutrient management factors, tillage management factors, pest management factors, irrigation management, and additional conservation practices about an evaluated field need be entered into the index at the tool’s website. The WQIag calculates these parameters into a single rating on a 10-point scale, with 0 being very poor and 10 being excellent. A WQIag score or estimated trend may have a relationship to nutrient load monitoring in stream studies conducted by other agencies or entities.
Leaching Index (LI, for Nitrogen and other soluble nutrients)
The LI is the NRCS approved tool designed to help farmers and nutrient managers to quickly assess nitrogen loss risk related to agricultural nitrogen management. The LI is an indicator of the potential for nitrate to reach groundwater. Nitrate, because it is water soluble, moves downward as water percolates through the soil. The extent of percolation depends on permeability, pore-size distribution, soil depth to a restrictive layer, artificial drainage, and precipitation amount and distribution over the year. For Mississippi, as for most of the States, the LI values for a selected soil and climate are considered as estimated in RUSLE2 (USDA- NRCS, 2012).
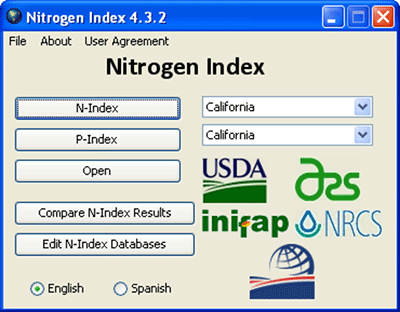
Nitrogen Index (NI)
The Nitrogen Index tool is designed to help nutrient managers quickly assess N loss risk related to agricultural N management; this tool includes both the N and P indices. Nitrogen Index 4.5 is written in the programming language Java and includes the N index for California, Mexico, and the Caribbean. These indices were originally developed as separate software programs that work within Microsoft Excel® 2003. All three indices are now available in Nitrogen Index 4.5 in both English and Spanish versions. This version also includes two choices for measurement units: English and metric. Additionally, the Nitrogen Index and Sustainability Index have been developed for Bolivia and Ecuador.
1Rill and interrill erosion is the removal of layers from the land surface by the action of rainfall and runoff. Erosion begins with the impact of raindrops, detaching soil particles and moving them across the surface. This process causes interrill erosion (sometimes called sheet erosion). Runoff from interrill erosion will collect and form rills across the hill slope. Sediment from rill and interrill erosion is transported down slope to where it slows enough to be deposited on the land surface or deposited directly into concentrated flow channels.